Observability for FreeRTOS with Tracealyzer and DevAlert from Percepio
Percepio is the company behind the well-known Tracealyzer, a desktop application that
enables embedded engineers to visually diagnose issues within their own software through traces. What is a trace? A trace is a low-level logging mechanism that can be used to
interpret a system state during execution. Analyzing traces for microcontroller-based applications using FreeRTOS can save embedded engineers significant time and energy when
troubleshooting unexpected behavior. Utilizing this tool with a FreeRTOS application requires a simple integration of the
TraceRecorder library to capture traces. Traces can be recorded and saved
with snapshots during program execution, or streamed in real-time.
Once a trace is loaded, Tracealyzer can provide execution details with configurable views like the program timeline, event log, CPU load graphs, memory usage, task dependencies, and
many other useful visualizations. These capabilities aid in what is referred to as observability. You can trace your tasks, as well as kernel API calls, at a deep level within your
FreeRTOS application. Below is a snapshot of Tracealyzer running on a laptop with a sample FreeRTOS trace loaded. Notice the FreeRTOS API calls in the trace view panel, such as
xQueueSend() and xQueueReceive(). Beyond just code debugging, you can also see the CPU load graphs correlated with the trace sequence.
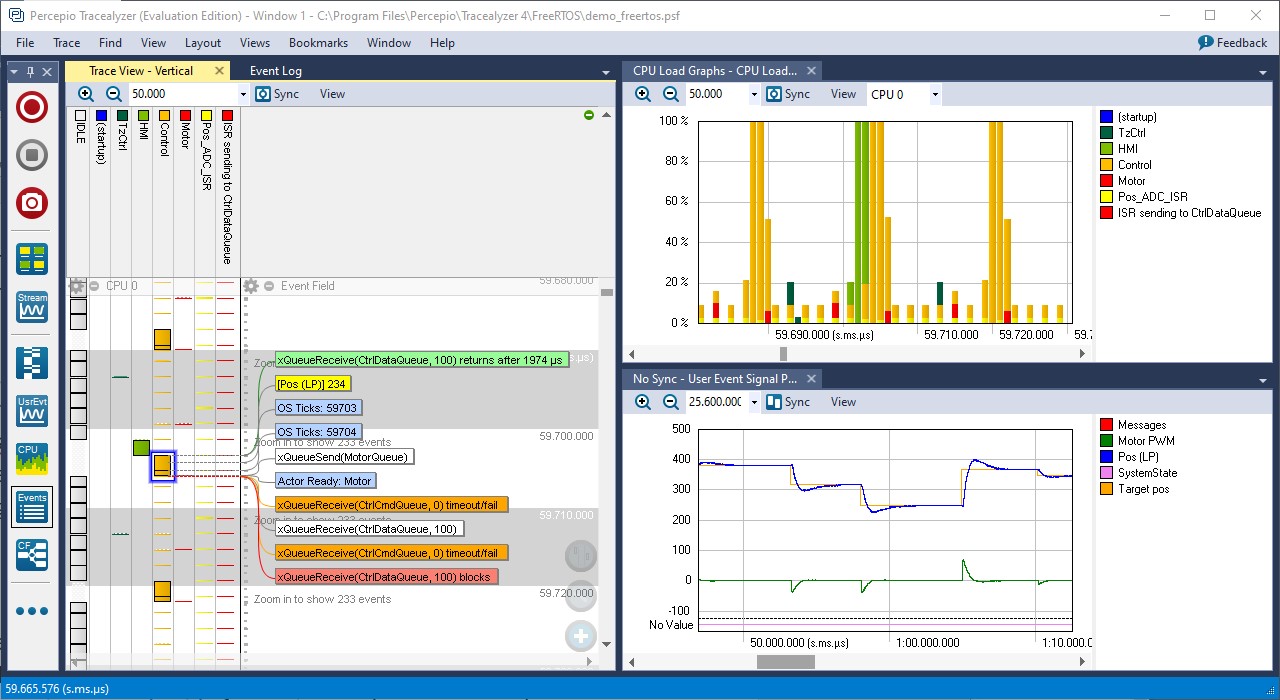 Tracealyzer with a sample FreeRTOS trace loaded. Click to enlarge.
Tracealyzer can be used during the development and testing of embedded applications, or to triage issues encountered in the field. You can learn more about how to use the tool by
visiting Tracealyzer for FreeRTOS on the Percepio website. Also, follow
this helpful getting started guide for setting up the
TraceRecorder library with your FreeRTOS applications.
In addition to Tracealyzer, Percepio also has a cloud-based offering called DevAlert. DevAlert
compliments Tracealyzer and has a number of features geared for production use cases. Coming from the other end of the observability spectrum, DevAlert is a service that can be
configured to capture specific diagnostics from remote device fleets through cloud connectivity. An important point is that you can define the specific data elements that are meaningful
and the types of alerts you want to raise. Plus, neither the device firmware nor the diagnostic data needs to be sent to the DevAlert service directly, rather it is stored in your own
cloud account (AWS S3 as an example).
The use of separated storage addresses privacy and security concerns, as this data remains in the device builder's account and is not uploaded to the Percepio service. The diagnostic data
is still accessible by a single click, thanks to a hybrid design involving the desktop client, DevAlert Dispatcher, that downloads the requested data from the separated storage when
triggered by a DevAlert dashboard link. Below is an architecture diagram for the DevAlert service which shows this separated storage paradigm.
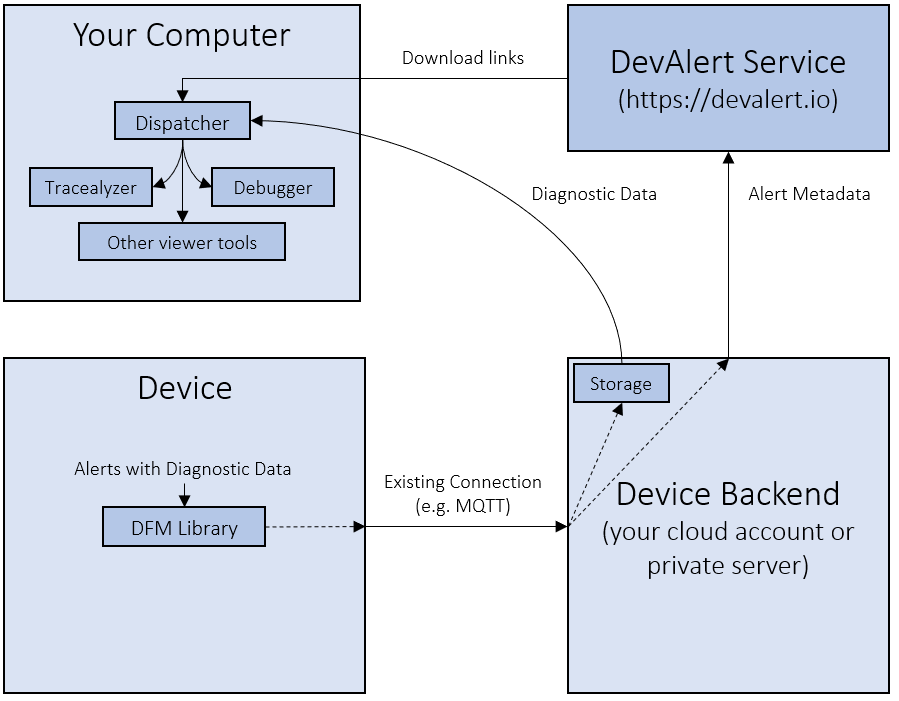 Figure 2: DevAlert architecture. Click to enlarge.
This architecture allows for multiple types of debugging data, with associated desktop tools. You can get Tracealyzer traces to see the sequence of events leading up to the
detected anomaly. In addition, support for GDB crash dumps has recently been added, as shown in the following screenshot.
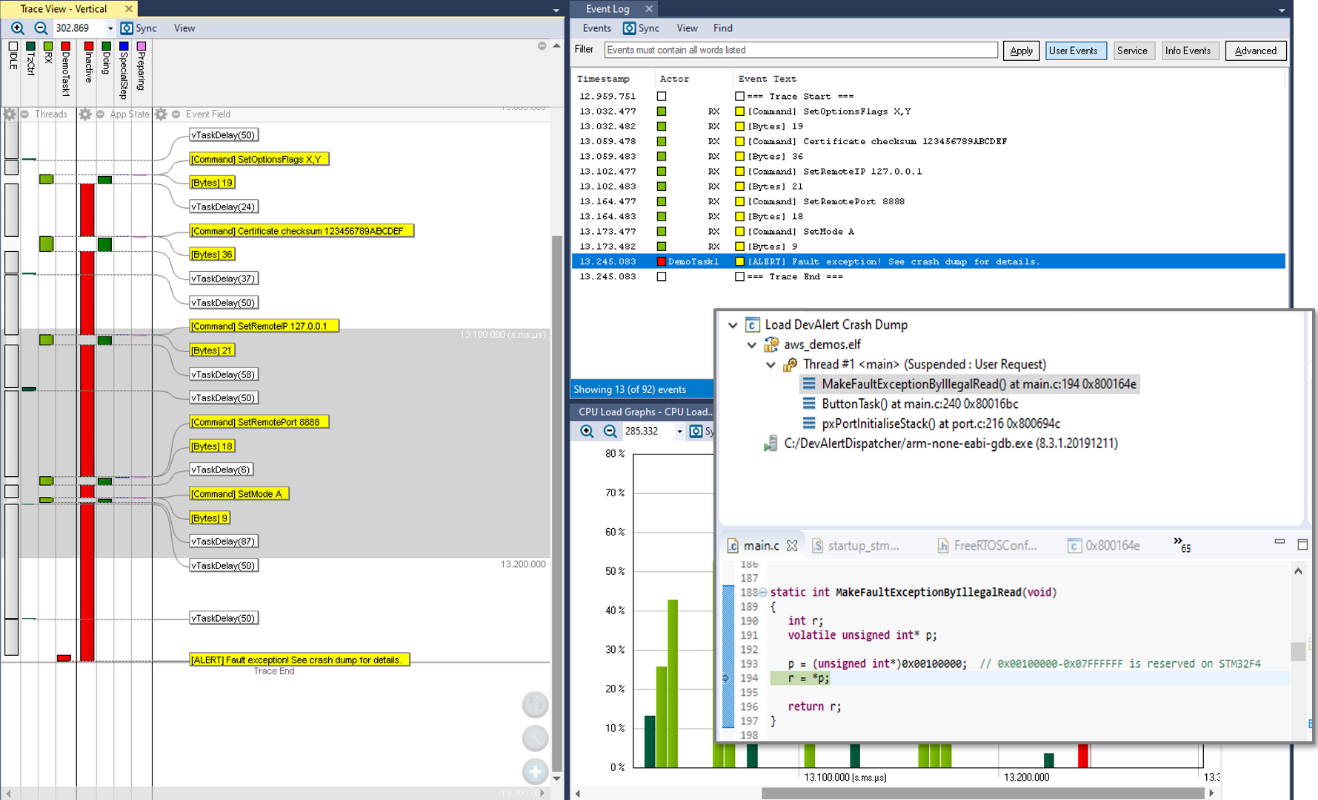 Figure 3: GDB crash dump screenshot. Click to enlarge.
You can analyze crashes and other anomalies in more detail using your regular source-code debugger, just like when debugging a local device. You can also add your own diagnostic
payloads, viewer tools, and scripts in case you have more specific needs.
The easiest way to explore the capabilities of DevAlert is to launch a sandbox environment, which Percepio provides as a free trial. The sandbox includes a FreeRTOS sample application running in a QEMU
emulator as a virtual device connecting to DevAlert.
First, sign up, then sign in to DevAlert, and press "Activate Service" in the console. It only takes a few steps and you will have access to a virtual desktop in your browser that
shows a simulated elevator project. The elevator controller in the example is a virtual device running a FreeRTOS application and has been configured to produce different types
of alerts. The elevator animation illustrates what is happening with the controller at any given time.
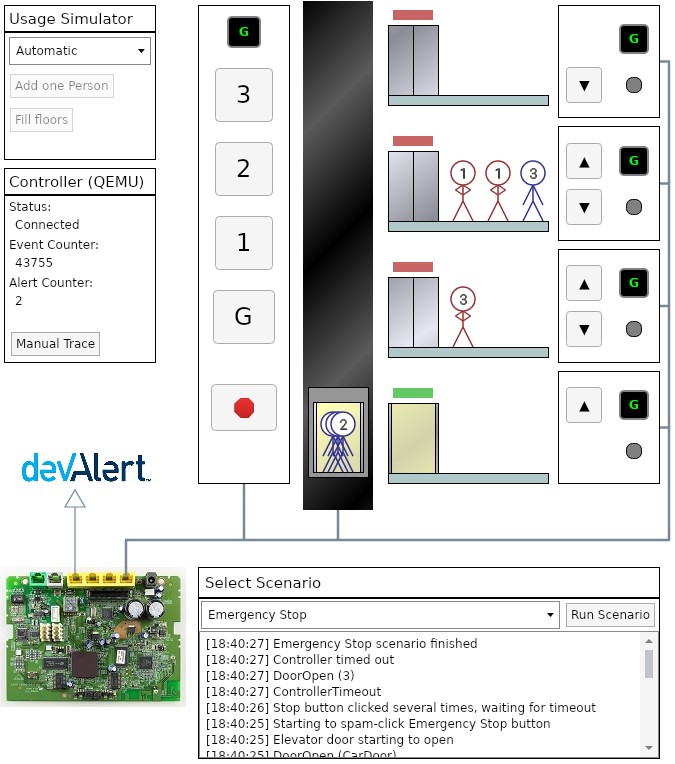 Figure 4: Simulated elevator project. Click to enlarge.
You can explore the source code to see how the alerts have been configured according to the type of events encountered in the running FreeRTOS application. A set of scenarios are
provided to provoke known issues to demonstrate the alerts. After executing a scenario, go back to the DevAlert console and click on the dashboard. Here you can see an overview of
issues, where alerts have been grouped by uniqueness. The dashboard will update as alerts are sent to the service.
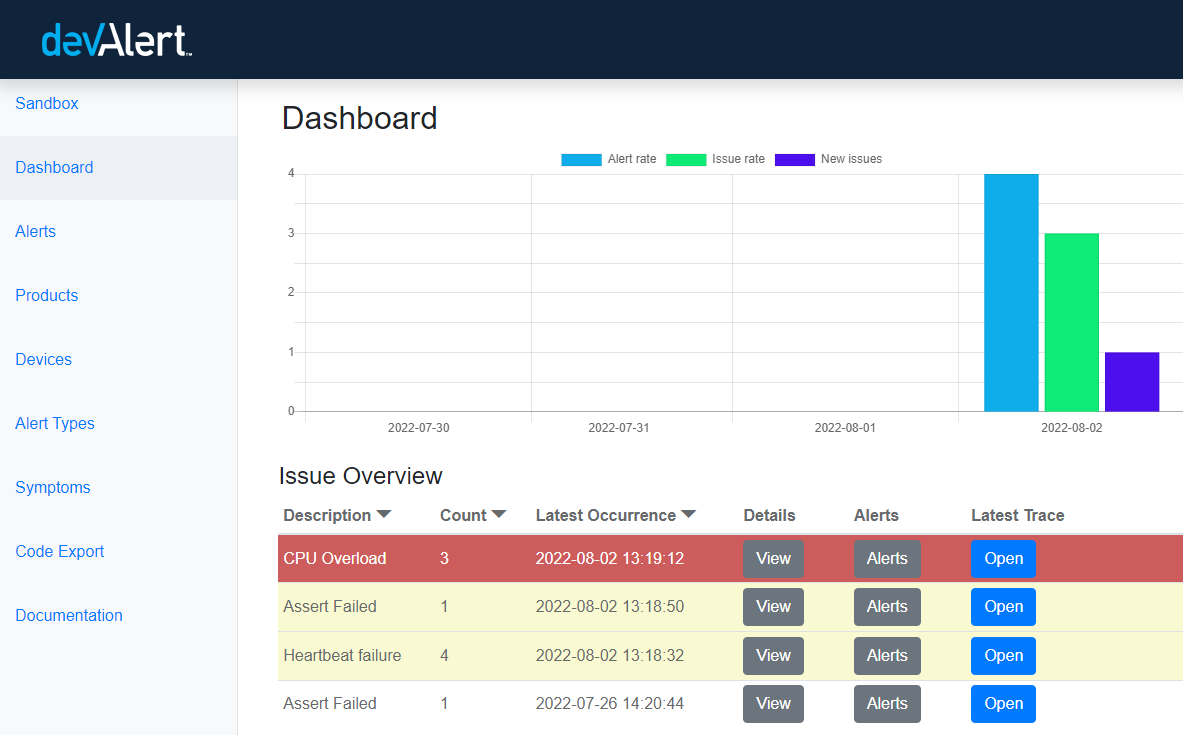 Figure 5: DevAlert console. Click to enlarge.
As you can see from the dashboard "Open" button, it is even possible to launch Tracelyzer from DevAlert if you want to dive deeper into the trace itself from the device. In this way,
both tools complement each other to bring a full picture of observability to FreeRTOS applications. There is a great deal more to explore with Tracealyzer and DevAlert for FreeRTOS, so
follow the links above to get started with your own embedded applications. Happy tracing!
Copyright (C) Amazon Web Services, Inc. or its affiliates. All rights reserved.